Melting Temperatures of Fe92.5O2.2S5.3 under High Pressure
-
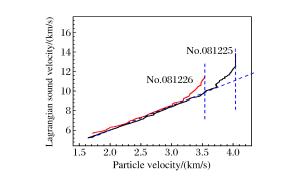
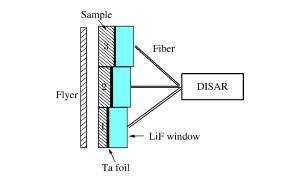
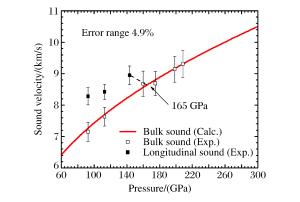
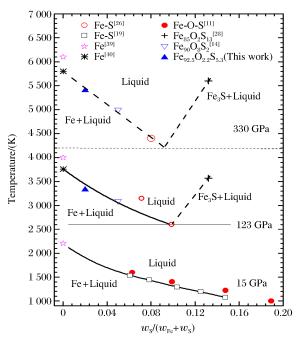
摘要: 采用反向碰撞法与光分析技术,测量了Fe92.5O2.2S5.3(质量分数比)在208 GPa下的声速,发现固态Fe92.5O2.2S5.3的纵波声速在144 GPa下开始减小,直到165 GPa完全转变为液态体波声速,表明样品的完全熔化温度为(3 500±400)K。将该熔化温度作为参考点,应用Lindeman定律并外推至地球内外核边界可知,Fe92.5O2.2S5.3的熔化温度为(5 000±400)K。通过比较Fe、Fe-O、Fe-S以及Fe-O-S的熔化温度,发现O元素对Fe熔化温度的影响很小,S元素对Fe熔化温度的降低与其含量成正比。如果外地核中S的质量分数为2%~6%,则地球内外核界面温度为5 000~5 400 K。Abstract: In the present work we determined the sound velocities of shocked Fe92.5O2.2S5.3 (in weight percent) under pressures up to 208 GPa using the reverse-impact method and the optical analyzer technique.We found that the longitudinal sound velocities of the solid Fe92.5O2.2S5.3 began to decrease at 144 GPa and completely transformed to bulk sound velocity of liquid at 165 GPa, indicating that the completely melting temperature of the sample is about (3 500±400)K based on the energy conservation relation.With respect to this point as reference, the melting temperature of Fe92.5O2.2S5.3 is about (5 000±400)K when extrapolated to the boundary of the inner/outer core using the Lindeman Law.Compared with the already measured melting temperatures of Fe, Fe-O, Fe-S and Fe-O-S, it shows that the oxygen has little effect on the melting of iron, and the melting depression of iron increases with sulfur content in the sample.If the mass fraction of the sulfur in the outer core is 2%-6%, the temperature is about 5 000-5 400 K at the inner core/outer core boundary of the Earth.
-
Key words:
- Fe-O-S /
- sound velocity /
- melting temperature /
- Earth's outer core
-
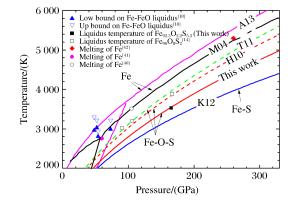
图 9 Fe、Fe-O、Fe-S、Fe-O-S体系在高压下的熔化温度和液相线温度随压强的变化(红色实线为本研究得到的Fe92.5O2.2S5.3的熔化温度。Fe:Ma等[40],标记为M04;Anzellini等[39],标记为A13。Fe-O-S体系:Terasaki等[28],标记为T11;Huang等[14],标记为H10。Fe-S体系:Kamada等[26],标记为K12。)
Figure 9. Melting temperature of Fe-O-S system compared with those of Fe, Fe-O and Fe-S (The red solid line shows the melting temperature of Fe92.5O2.2S5.3 from this study.The lines labeled as M04 and A13 represent the melting temperatures of Fe from Ref.[40] and Ref.[39] respectively.The dashed lines labeled as H10 and T11 represent the melting temperature of Fe90O8S2[14] and the liquidus and solidus temperature of Fe-O-S[28].K12 represent the melting relationships in the Fe-Fe3S system up to the outer core conditions[26].)
表 1 Fe、FeO、FeS和Fe-O-S体系参数
Table 1. Parameters for Fe, FeO, FeS and Fe-O-S system
Material ρ0/(g/cm3) C0/(km/s) λ γ0 q β0/(J·kg-1·K-2) κ E0/(kJ) α-Fe 7.85[43] 3.935[43] 1.578[43] ε-Fe 8.298[44] 4.720* 1.523* 1.76* 0.76* 0.091[45] 1.34[45] 76.268 4[44] FeO(B1) 5.71[46] 5.83* 0.99* 57.796 7[47] FeO(B8) 6.05[46, 48] 4.486* 1.699* 1.8[48] 1[48] 0[49] 0[49] FeS 4.602[50] 2.947[50] 1.578[50] 1.54[50] 1[50] 0.25[51] 1.34[51] 33.707 5[52] Fe90O8S2 6.69[14] 3.97[14] 1.58[14] 1.85[14] 0.87[14] 0.075[14] 1.39[14] 67.315 Fe92.5O2.2S5.3 6.88 3.71 1.61 1.82 0.85 0.119 1.407 68.258 Note:The asterisk * represents the fitted results from the Hugoniot data. -
[1] BIRCH F.Density and composition of mantle and core[J]. J Geophys Res, 1964, 69(20):4377-4388. doi: 10.1029-JZ069i020p04377/ [2] POIRIER J P.Light elements in the Earth's outer core:a critical review[J]. Phys Earth Planet Inter, 1994, 85(3/4):319-337. doi: 10.1016-0031-9201(94)90120-1/ [3] HILLGREN V J, GESSMANN C K, LI J.Origin of the Earth and Moon[M]. New York:Springer, 2000:245-263. [4] HOLLAND H D, TUREKIAN K.Treatise on geochemistry[M]. Oxford:Elsevier, 2003:527-557. [5] MURTHY V R, HALL H T.The chemical composition of the Earth's core:possibility of sulphur in the core[J]. Phys Earth Planet Inter, 1970, 2(4):276-282. http://www.sciencedirect.com/science/article/pii/0031920170900142 [6] USSELMAN T M.Experimental approach to the state of the core:Part Ⅰ, the liquidus relations of the Fe-rich portion of the Fe-Ni-S system from 30 to 100 kb[J]. Am J Sci, 1975, 275(3):278-290. doi: 10.2475/ajs.275.3.278 [7] FEI Y W, BERTKA C M, FINGER L W.High-pressure iron-sulfur compound, Fe3S2, and melting relations in the Fe-FeS system[J]. Science, 1997, 275(5306):1621-1623. doi: 10.1126/science.275.5306.1621 [8] FEI Y W, LI J, BERTKA C M, et al.Structure type and bulk modulus of Fe3S, a new iron-sulfur compound[J]. Am Mineral, 2000, 85(11/12):1830-1833. https://www.degruyter.com/view/j/ammin.2000.85.issue-11-12/am-2000-11-1229/am-2000-11-1229.xml [9] LI J, FEI Y W, MAO H K, et al.Sulfur in the Earth's inner core[J]. Earth Planet Sci Lett, 2001, 193(3):509-514. http://www.sciencedirect.com/science/article/pii/S0012821X01005210 [10] RINGWOOD A E.Composition of the core and implications for origin of the Earth[J]. Geochem J, 1977, 11(3):111-135. [11] URAKAWA S, KATO M, KUMAZAWA M.Experimental study on the phase relations in the system Fe-Ni-O-S up to 15 GPa[J]. High-Pressure Research in Mineral Physics:A Volume in Honor of Syun-iti Akimoto, 1987:95-111. http://adsabs.harvard.edu/cgi-bin/nph-data_query?bibcode=1987GMS....39...95U&db_key=PHY&link_type=ABSTRACT [12] HELFFRICH G, KANESHIMA S.Seismological constraints on core composition from Fe-O-S liquid immiscibility[J]. Science, 2004, 306(5705):2239-2242. http://europepmc.org/abstract/MED/15618514 [13] HUANG H J, FEI Y W, CAI L C, et al.Evidence for an oxygen-depleted liquid outer core of the Earth[J]. Nature, 2011, 479(7374):513-516. doi: 10.1038/nature10621 [14] HUANG H J, HU X J, JING F Q, et al.Melting behavior of Fe-O-S at high pressure:a discussion on the melting depression induced by O and S[J]. J Geophys Res, 2010, 115(B5). doi: 10.1029/2009JB006514/full [15] OHTANI E, RINGWOOD A E, HIBBERSON W.Composition of the core, Ⅱ.effect of high pressure on solubility of FeO in molten iron[J]. Earth Planet Sci Lett, 1984, 71(1):94-103. http://www.sciencedirect.com/science/article/pii/0012821X84900554 [16] KATO T, RINGWOOD A E.Melting relationships in the system Fe-FeO at high pressures:implications for the composition and formation of the Earth's core[J]. Phys Chem Miner, 1989, 16(6):524-538. doi: 10.1007/BF00202207 [17] RINGWOOD A E, HIBBERSON W.The system Fe-FeO revisited[J]. Phys Chem Miner, 1990, 17(4):313-319. doi: 10.1007/BF00200126 [18] SEAGLE C T, HEINZ D L, CAMPBELL A J, et al.Melting and thermal expansion in the Fe-FeO system at high pressure[J]. Earth Planet Sci Lett, 2008, 265(3/4):655-665. http://www.sciencedirect.com/science/article/pii/S0012821X07007261 [19] ANDRAULT D, BOLFAN-CASANOVA N, OHTAKA O, et al.Melting diagrams of Fe-rich alloys determined from synchrotron in situ measurements in the 15-23 GPa pressure range[J]. Phys Earth Planet Inter, 2009, 174(1):181-191. http://www.sciencedirect.com/science/article/pii/S0031920108002756 [20] WILLIAMS Q, JEANLOZ R.Melting relations in the iron-sulfur system at ultra-high pressures:implications for the thermal state of the Earth[J]. J Geophys Res B, 1990, 95(12):19299-19310. doi: 10.1029/JB095iB12p19299/full [21] BOEHLER R.Fe-FeS eutectic temperatures to 620 kbar[J]. Phys Earth Planet Inter, 1996, 96(2):181-186. http://www.sciencedirect.com/science?_ob=ArticleURL&_udi=B6V6S-3WDC4CB-9&_user=1492051&_coverDate=08%2F31%2F1996&_rdoc=10&_fmt=high&_orig=browse&_origin=browse&_zone=rslt_list_item&_srch=doc-info(%23toc%235822%231996%23999039997%2393835%23FLP%23display%23 [22] CHUDINOVSKIKH L, BOEHLER R.Eutectic melting in the system Fe-S to 44 GPa[J]. Phys Earth Planet Inter, 2007, 257(1/2):97-103. http://www.sciencedirect.com/science/article/pii/S0012821X07001045 [23] CAMPBELL A J, SEAGLE C T, HEINZ D L, et al.Partial melting in the iron-sulfur system at high pressure:a synchrotron X-ray diffraction study[J]. Phys Earth Planet Inter, 2007, 162(1):119-128. http://www.sciencedirect.com/science/article/pii/S0031920107000611 [24] MORARD G, ANDRAULT D, GUIGNOT N, et al.In situ determination of Fe-Fe3S phase diagram and liquid structural properties up to 65 GPa[J]. Earth Planet Sci Lett, 2008, 272(3):620-626. http://www.sciencedirect.com/science/article/pii/S0012821X08003555 [25] KAMADA S, TERASAKI H, OHTANI E, et al.Phase relationships of the Fe-FeS system in conditions up to the Earth's outer core[J]. Earth Planet Sci Lett, 2010, 294(1):94-100. http://www.sciencedirect.com/science/article/pii/S0012821X10001822 [26] KAMADA S, OHTANI E, TERASAKI H, et al.Melting relationships in the Fe-Fe3S system up to the outer core conditions[J]. Earth Planet Sci Lett, 2012, 359:26-33. http://www.sciencedirect.com/science/article/pii/S0012821X12005341 [27] TSUNO K, OHTANI E.Eutectic temperatures and melting relations in the Fe-O-S system at high pressures and temperatures[J]. Phys Chem Miner, 2008, 36(1):9-17. doi: 10.1007/s00269-008-0254-2 [28] TERASAKI H, KAMADA S, SAKAI T, et al.Liquidus and solidus temperatures of a Fe-O-S alloy up to the pressures of the outer core:implication for the thermal structure of the Earth's core[J]. Earth Planet Sci Lett, 2011, 304(3):559-564. http://www.sciencedirect.com/science/article/pii/S0012821X11001208 [29] DUFFY T S, AHRENS T J.Compressional sound velocity, equation of state, and constitutive response of shock-compressed magnesium oxide[J]. J Geophys Res B, 1995, 100(1):529-542. doi: 10.1029/94JB02065/full [30] HU J B, ZHOU X M, TAN H, et al.Successive phase transitions of tin under shock compression[J]. Appl Phys Lett, 2008, 92(11):111905. doi: 10.1063/1.2898891 [31] WENG J D, TAN H, WANG X, et al.Optical-fiber interferometer for velocity measurements with picosecond resolution[J]. Appl Phys Lett, 2006, 89(11):111101. http://d.old.wanfangdata.com.cn/NSTLQK/NSTL_QKJJ022295005/ [32] ASAY J R, CHHABILDAS L C.Determination of the shear strength of shock compressed 6061-T6 aluminum[M]//Shock Waves and High-Strain-Rate Phenomena in Metals.Springer, 1981: 417-431. [33] MITCHELL A C, NELLIS W J.Shock compression of aluminum, copper, and tantalum[J]. J Appl Phys, 1981, 52(5):3363-3374. doi: 10.1063-1.329160/ [34] BROWN J M, SHANER J W.Rarefaction velocities in shocked tantalum and the high pressure melting point[M]//Shock Waves in Condensed Matter-1983.North Holland: Springer Science & Business Media, 1984: 91-94. [35] HUANG H J, JING F Q, CAI L C, et al.Grüneisen parameter along Hugoniot and melting temperature of ε-iron:a result from thermodynamic calculations[J]. Chin Phys Lett, 2005, 22(4):836-838. http://www.cqvip.com/Main/Detail.aspx?id=15266957 [36] WALLACE D C.Melting of elements[J]. Proc Roy Soc A, 1991, 433(1889):631-661. doi: 10.1098/rspa.1991.0068 [37] BROWN J M, MCQUEEN R G.Phase transitions, Grüneisen parameter, and elasticity for shocked iron between 77 GPa and 400 GPa[J]. J Geophys Res B, 1986, 91(7):7485-7494. doi: 10.1029-JB091iB07p07485/ [38] ANDERSON O L.The power balance at the core-mantle boundary[J]. Phys Earth Planet Inter, 2002, 131(1):1-17. http://www.sciencedirect.com/science/article/pii/S0031920102000092 [39] ANZELLINI S, DEWAELE A, MEZOUAR M, et al.Melting of iron at Earth's inner core boundary based on fast X-ray diffraction[J]. Science, 2013, 340(6131):464-466. http://www.ncbi.nlm.nih.gov/pubmed/23620049 [40] MA Y, SOMAYAZULU M, SHEN G, et al.In situ X-ray diffraction studies of iron to Earth-core conditions[J]. Phys Earth Planet Inter, 2004, 143(1):455-467. doi: 10.1016-j.pepi.2003.06.005/ [41] SHEN G, MAO H K, HEMLEY R J, et al.Melting and crystal structure of iron at high pressures and temperatures[J]. Geophys Res Lett, 1998, 25(3):373-376. doi: 10.1029/97GL03776/full [42] HUANG H J, JING F Q, CAI L C.Grüneisen parameter along Hugoniot and melting temperature of iron:a thermodynamic computational method[J]. Chin Phys Lett, 2005, 22(4):836-838. http://adsabs.harvard.edu/abs/2005ChPhL..22..836H [43] BROWN J M, FRITZ J N, HIXSON R S.Hugoniot data for iron[J]. J Appl Phys, 2000, 88(9):5496-5498. doi: 10.1063/1.1319320 [44] ANDERSON O L, DUBROVINSKY L, SAXENA S K, et al.Experimental vibrational Grüneisen ratio values for ε-iron up to 330 GPa at 300 K[J]. Geophys Res Lett, 2001, 28(2):399-402. doi: 10.1029/2000GL008544 [45] BONESS D A, BROWN J M, MCMAHAN A K.The electronic thermodynamics of iron under Earth core conditions[J]. Phys Earth Planet Inter, 1986, 42(4):227-240. doi: 10.1016/0031-9201(86)90025-7 [46] JACKSON I, KHANNA S K, REVCOLEVSCHI A, et al.Elasticity, shear-mode softening and high-pressure polymorphism of wüstite (Fe1-xO)[J]. J Geophys Res B, 1990, 95(13):21671-21685. doi: 10.1029/JB095iB13p21671/full [47] ANDERSON O L.The Grüneisen parameter for iron at outer core conditions and the resulting conductive heat and power in the core[J]. Phys Earth Planet Inter, 1998, 109(3):179-197. http://www.sciencedirect.com/science/article/pii/S003192019800123X [48] JEANLOZ R, AHRENS T J.Equations of state of FeO and CaO[J]. Geophys J Int, 1980, 62(3):505-528. doi: 10.1111/gji.1980.62.issue-3 [49] STIXRUDE L, WASSERMAN E, COHEN R E.Composition and temperature of Earth's inner core[J]. J Geophys Res B, 1997, 102(11):24729-24739. doi: 10.1029-97JB02125/ [50] BROWN J M, AHRENS T J, SHAMPINE D L.Hugoniot data for pyrhotite and the Earth's core[J]. J Geophys Res B, 1984, 89(7):6041-6048. http://adsabs.harvard.edu/abs/1984JGR....89.7835W [51] ANDERSON W W, AHRENS T J.Shock temperature and melting in iron sulfides at core pressures[J]. J Geophys Res B, 1996, 101(3):5627-5642. doi: 10.1029/95JB01972/abstract [52] STEVENSON D J.Models of the Earth's core[J]. Science, 1981, 214(4521):611-619. doi: 10.1126/science.214.4521.611 [53] DREIBUS G, PALME H.Cosmochemical constraints on the sulfur content in the Earth's core[J]. Geochimica et Cosmochimica Acta, 1996, 60(7):1125-1130. http://adsabs.harvard.edu/abs/1996GeCoA..60.1125D [54] MAHAN B, SIEBERT J, PRINGLE E A, et al.Elemental partitioning and isotopic fractionation of Zn between metal and silicate and geochemical estimation of the S content of the Earth's core[J]. Geochimica et Cosmochimica Acta, 2017, 196:252-270. doi: 10.1016/j.gca.2016.09.013 [55] HIROSE K, LABROSSE S, HERNLUND J.Composition and state of the core[J]. Annu Rev Earth Planet Sci, 2013, 41(1):657-691. http://d.old.wanfangdata.com.cn/OAPaper/oai_arXiv.org_0904.3849 -


 下载:
下载:

