


Improvement of the Design Program for Functionally Graded Materials with Controllable Loading and High-Throughput Optimization Design
-
摘要: 为了实现梯度材料高通量优化设计,需要梯度材料加载性能的准确性和快速预测能力。人工智能技术结合飞速发展的硬件条件已逐渐成为不同学科领域的革命性研究工具。在材料科学领域,机器学习方法在材料的高通量设计和性能的高通量预测方面均发挥着巨大作用。在可控加载梯度材料优化设计中引入机器学习方法,结合基于物理模型的计算结果,建立了较为准确的快速预测模型,显著提高了优化计算通量。多物质流体弹塑性计算程序MLEP在梯度材料实验设计和数据解读中已经过多轮校验,对实验结果具有较高的预测精度,基于该程序的数值实验样本可以建立高精度的代理模型。为了使MLEP可以应用于更宽范围的密度梯度材料设计及实验预测,在现有模拟程序中加入了p-α 模型,用于描述低密度聚合物在冲击/准等熵加载中的力学行为,可以实现飞片密度从0.5 g/cm3左右增大至15.0 g/cm3。Abstract: To achieve high-throughput optimization design of gradient materials, it is essential to establish accurate and rapid predictive capabilities for the loading performance of such materials. The rapid advancement of artificial intelligence technology combined with hardware development has gradually become a revolutionary research tool across various scientific fields. In materials science, machine learning methods play a significant role in high-throughput material design and performance prediction. This study introduces machine learning methods into the optimization design of functionally graded materials with controllable loading. By integrating computational results from physics-based models, a relatively accurate rapid prediction model was established, significantly enhancing optimization throughput. The multi-material fluid-elastoplastic computational program MLEP has undergone multiple rounds of validation in the experimental design and data interpretation of gradient materials, demonstrating high predictive accuracy for experimental results. Numerical experimental samples based on this program can be used to construct high-precision surrogate models. To extend MLEP’s applicability to a broader range of density-gradient material design and experimental prediction, the p-α model has been incorporated into the existing simulation framework. This model describes the mechanical behavior of low-density polymers under shock/quasi-isentropic loading, enabling the expansion of flyer plate density from approximately 0.5 g/cm3 to 15.0 g/cm3.
-

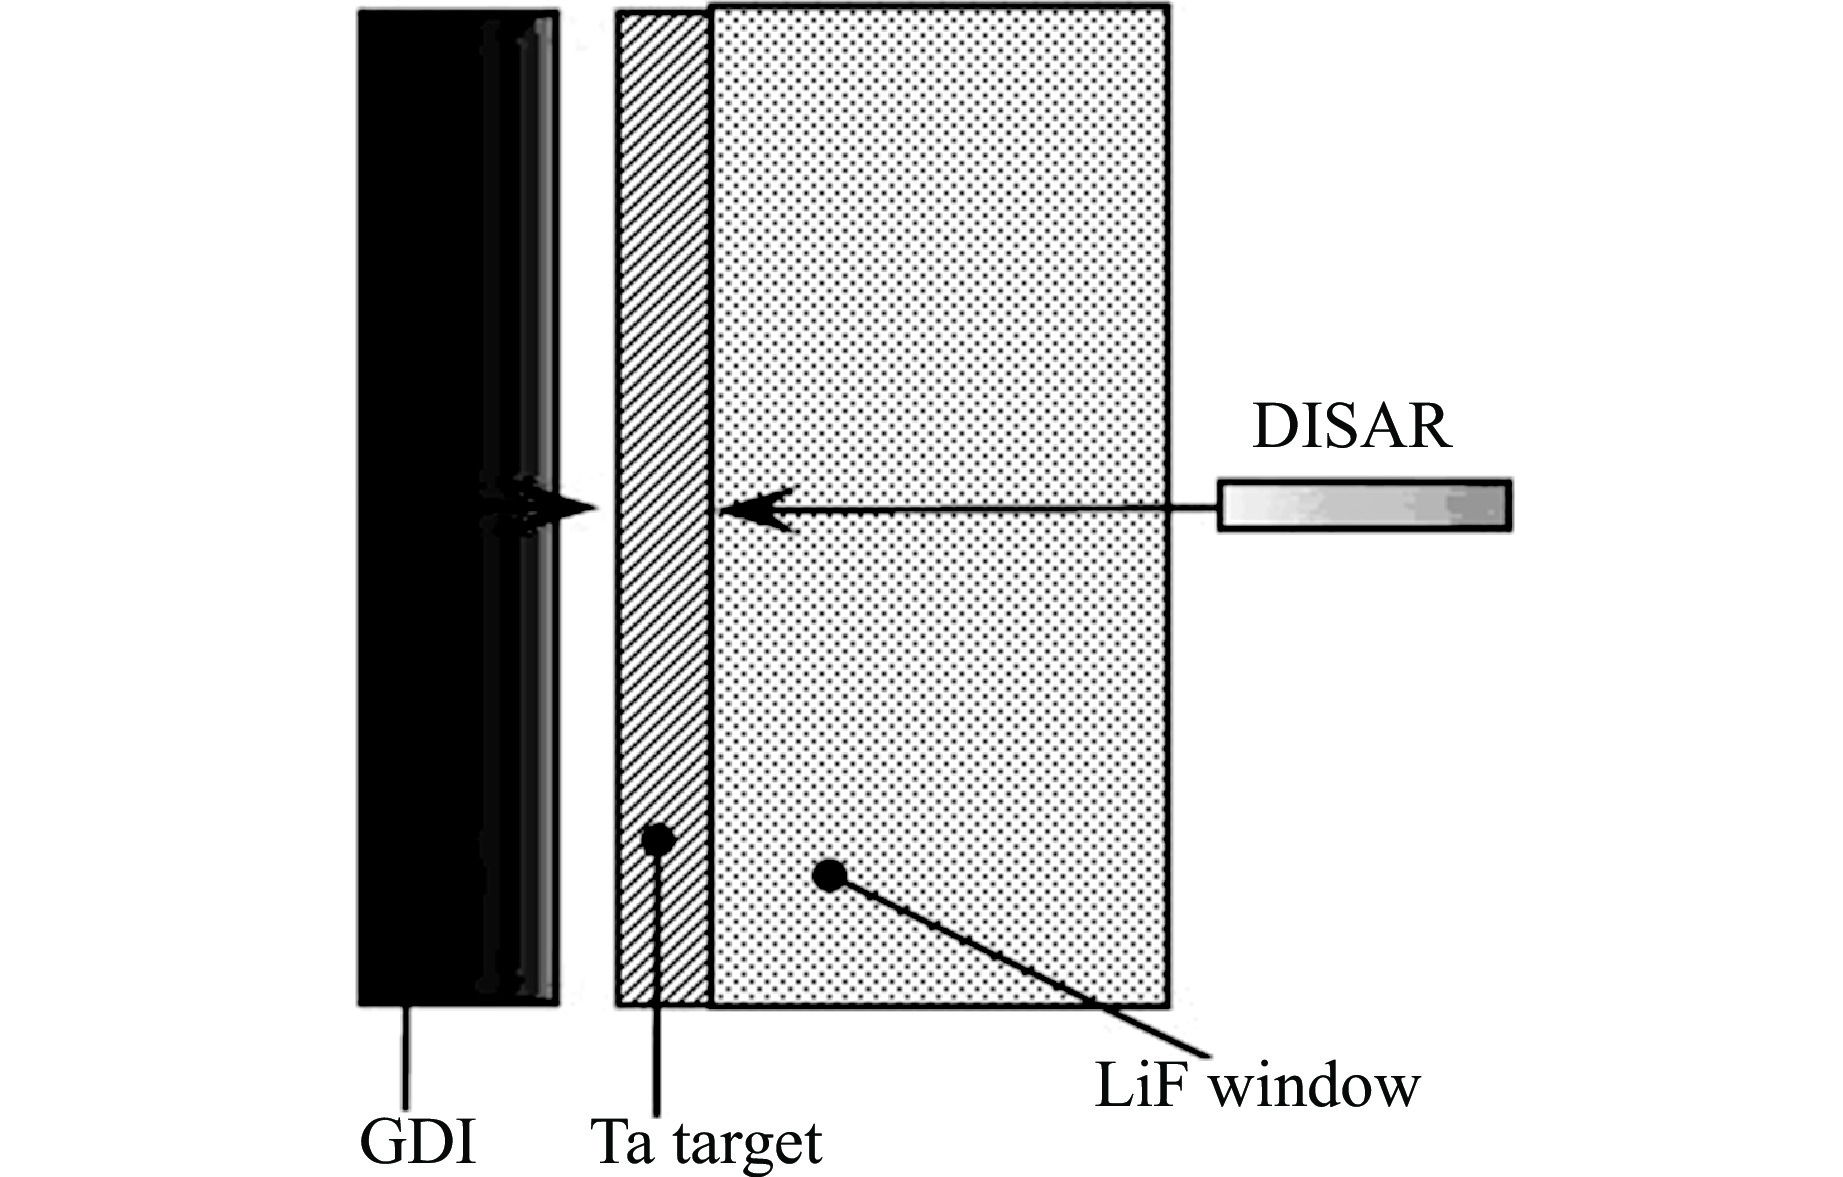
图 2 复杂加载实验示意图
Figure 2. Schematic diagram of the configuration of the complexity loading experiment
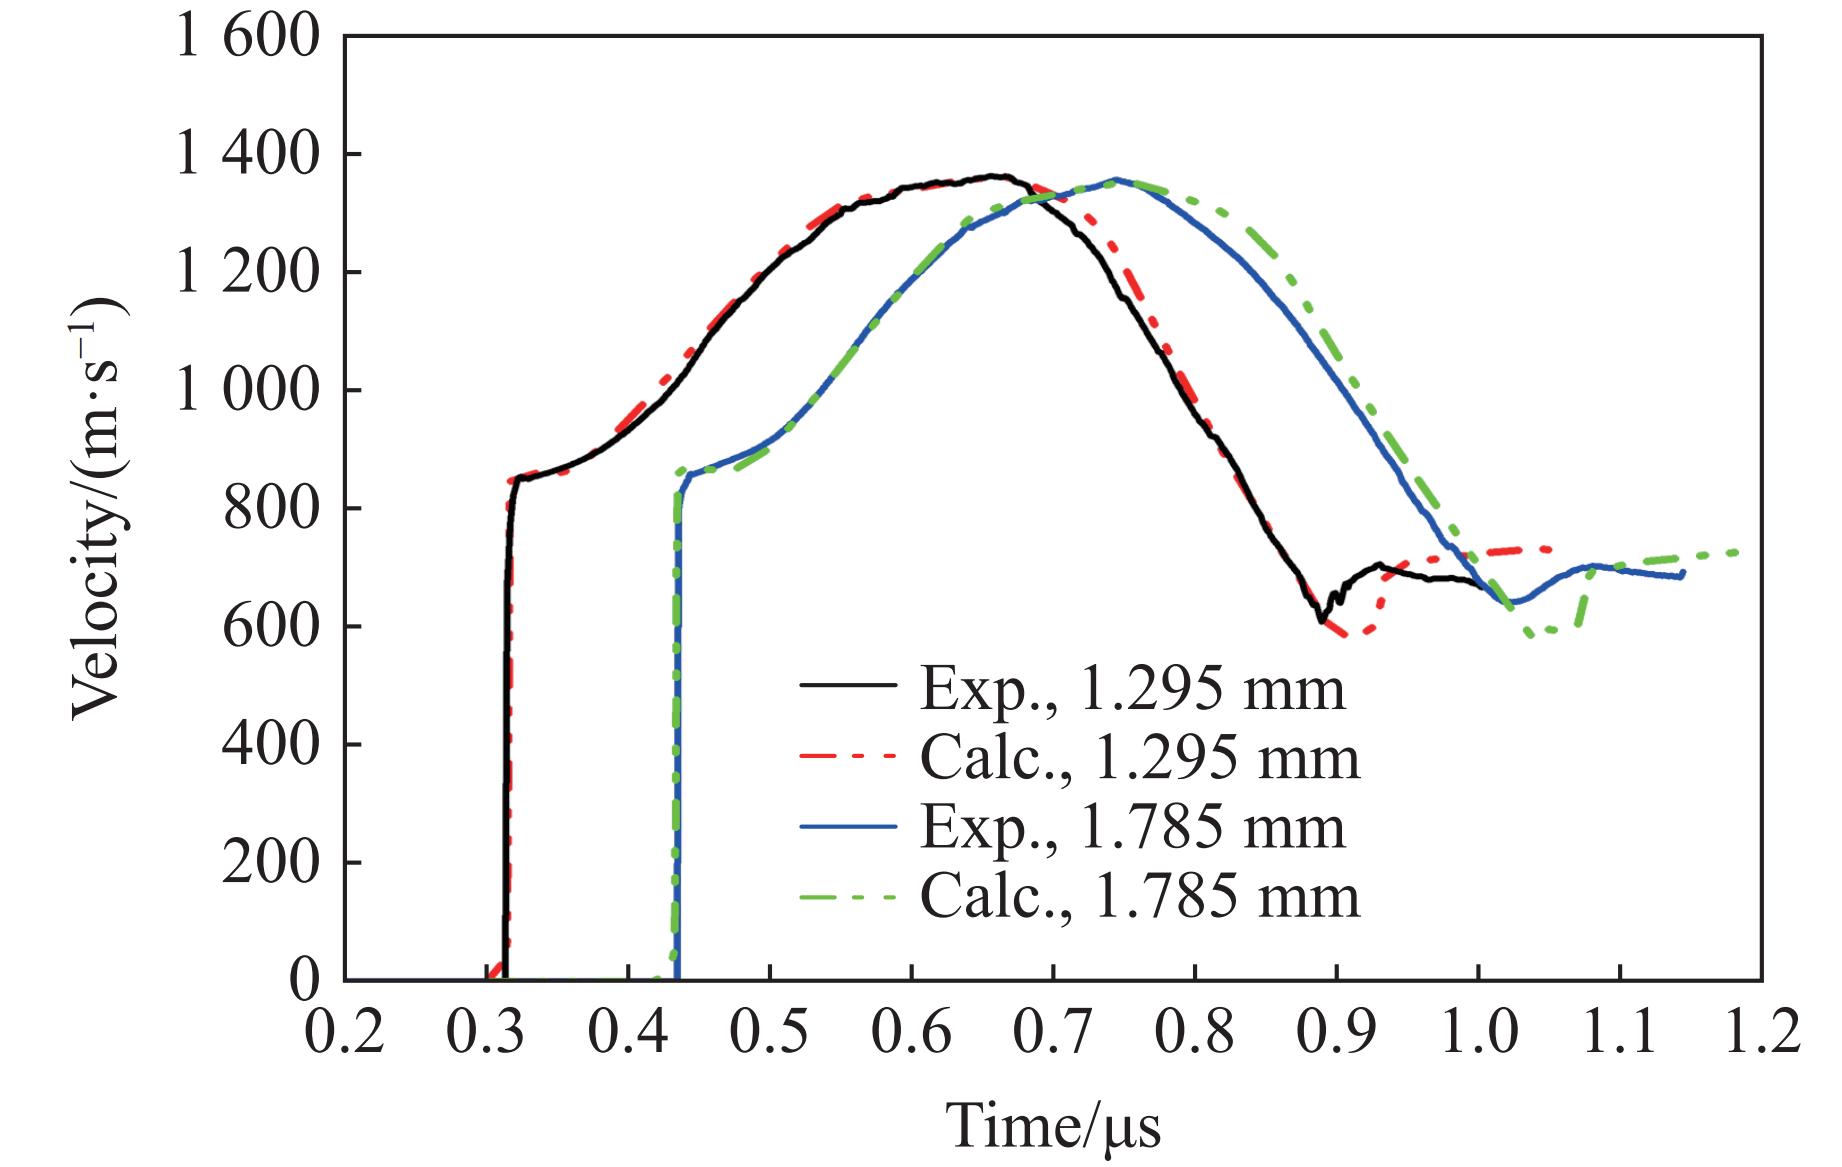
图 3 飞片自由表面速度数值计算与实验结果对比
Figure 3. Comparison of the flyer free surface velocity between calculation and experimental results
图 6 MLEP与Eula程序计算结果对比
Figure 6. Comparison of calculation results between MLEP and Eula program
图 7 MLEP计算结果与实验结果对比
Figure 7. Comparison of calculation results by MLEP and experimental results
图 9 机器学习得到快速预测模型的研究思路
Figure 9. Research approach for developing fast prediction models using machine learning

图 10 代理模型与MLEP得到的样品界面粒子速度历史曲线对比
Figure 10. Comparison of particle velocity-time curves of sample interface obtained by surrogate model and MLEP
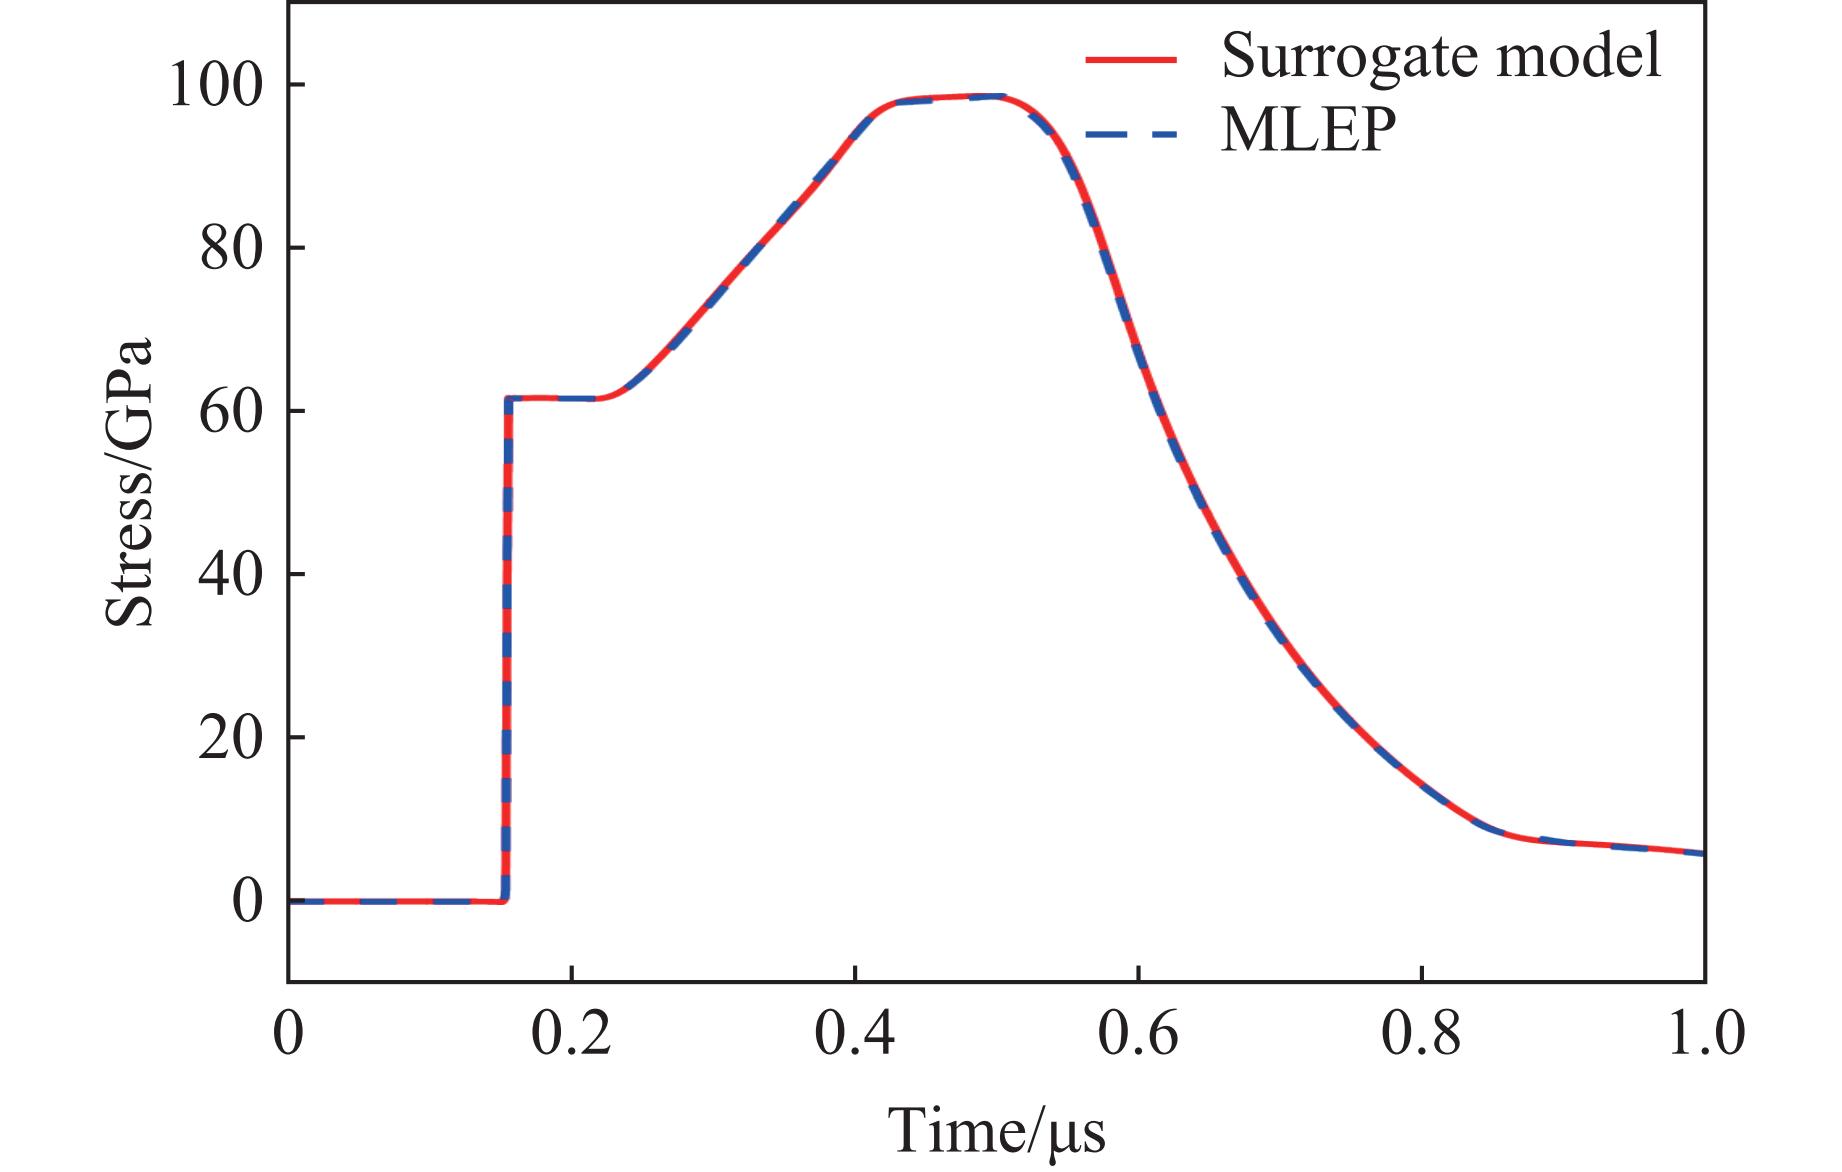
图 11 代理模型与MLEP得到的样品原位应力历史曲线对比
Figure 11. Comparison of sample in-situ stress-time curves obtained by surrogate model and MLEP
表 1 GDI的设计参数
Table 1. GDI design parameters
No. Thickness/mm Mass fraction/% Al Cu C 1 0.40 100.000 0 0 2 0.05 93.003 3.997 3.0 3 0.05 92.195 4.805 3.0 4 0.05 87.019 9.981 3.0 5 0.05 80.815 16.185 3.0 6 0.05 73.920 23.080 3.0 7 0.05 66.643 30.357 3.0 8 0.05 59.254 37.746 3.0 9 0.05 51.970 45.030 3.0 10 0.05 44.956 52.044 3.0 11 0.05 38.327 58.673 3.0 12 0.05 32.155 64.845 3.0 13 0.05 26.479 70.521 3.0 14 0.05 21.307 75.693 3.0 15 0.05 16.632 80.368 3.0 16 0.05 12.431 84.569 3.0 17 0.05 8.673 88.327 3.0 18 0.05 5.324 91.676 3.0 19 0.05 2.346 94.654 3.0 20 0.05 0.500 96.500 3.0 21 0.40 0 100.000 0  下载: 导出CSV
表 2 训练数据集中的输入变量
Table 2. Input variables in the training dataset
Operating condition parameters Spatio-temporal field variables Flying layer front
density/(g·cm−3)Flying layer rear
density/(g·cm−3)Flying layer density
distribution indexImpact velocity/
(km·s–1)Test position/mm Historical time/μs 2.713, 3.000,
3.500, 4.0006.0, 6.5, 7.0, 7.5,
8.0, 8.5, 8.90.1, 0.3, 0.5, 0.7,
0.9, 2.0, 4.0,
6.0, 8.0, 10.01.0, 2.0, 3.0,
4.0, 5.00.2−2.0 0−2.0
下载: 导出CSV
表 3 测试结果
Table 3. Testing results
Case
No.ρ1/(g·cm−3) ρ2/(g·cm−3) C u0/(km·s–1) Functional
moduleTest prediction error/% Velocity
peakPressure
peakAverage
strain rateT1 2.87 8.12 2.86 0.2525 Complete coverage 0.29 0.42 0.04 T2 3.13 8.41 1.06 0.4325 Complete coverage 0.27 0.41 1.36 T3 3.84 7.54 0.84 0.4175 Complete coverage 0.10 0.13 1.59 T4 3.52 8.27 3.09 0.3275 Complete coverage 0.38 0.60 0.28 T5 3.58 7.68 0.61 0.3425 Complete coverage 0.37 0.50 1.08 T6 3.45 7.97 4.66 0.4775 Complete coverage 0.20 0.28 1.17 T7 3.00 6.07 2.19 0.4925 Complete coverage 0.02 0.03 6.21 T8 3.90 7.24 1.51 0.4475 Complete coverage 0.11 0.14 1.41 T9 3.77 6.95 3.54 0.3125 Complete coverage 0.37 0.59 2.38 T10 3.32 7.10 4.44 0.2075 Complete coverage 0.04 0.01 4.53 T11 3.71 8.70 1.96 0.3725 Complete coverage 0.38 0.63 3.48 T12 3.20 6.66 3.31 0.3575 Complete coverage 0.19 0.39 3.18 T13 3.26 7.39 2.64 0.2975 Complete coverage 0.34 0.55 2.22 T14 3.65 6.80 3.76 0.4625 Complete coverage 0.17 0.17 1.65 T15 2.94 7.83 2.41 0.4025 Complete coverage 0.39 0.67 3.07 T16 3.97 8.85 1.74 0.3875 Complete coverage 0.28 0.47 4.25 T17 2.74 6.37 4.21 0.2825 Complete coverage 0.20 0.27 6.52 T18 3.07 8.56 1.29 0.2225 Complete coverage 0.04 0.20 0.83 T19 2.81 6.22 3.99 0.2675 Complete coverage 0.06 0.05 5.79 T20 3.39 6.51 4.89 0.2375 Complete coverage 0.09 0.09 1.14
下载: 导出CSV
-
[1] HOOVER W G. Structure of a shock-wave front in a liquid [J]. Physical Review Letters, 1979, 42(23): 1531–1534. doi: 10.1103/PhysRevLett.42.1531 [2] NGUYEN J H, ORLIKOWSKI D, STREITZ F H, et al. High-pressure tailored compression: controlled thermodynamic paths [J]. Journal of Applied Physics, 2006, 100(2): 023508. doi: 10.1063/1.2214209 [3] NGUYEN J H, ORLIKOWSKI D, STREITZ F H, et al. Specifically prescribed dynamic thermodynamic paths and resolidification experiments [J]. AIP Conference Proceedings, 2004, 706(1): 1225–1230. doi: 10.1063/1.1780459 [4] 柏劲松, 罗国强, 黄娇凤, 等. Pillow飞片气炮加载实验的数值模拟研究 [J]. 高压物理学报, 2011, 25(5): 390–394. doi: 10.11858/gywlxb.2011.05.002BAI J S, LUO G Q, HUANG J F, et al. Numerical simulation of the gas gun experiment with pillow impactor loading [J]. Chinese Journal of High Pressure Physics, 2011, 25(5): 390–394. doi: 10.11858/gywlxb.2011.05.002 [5] 柏劲松, 罗国强, 王翔, 等. Mg-W体系密度梯度飞片复杂加载实验的计算分析 [J]. 力学学报, 2010, 42(6): 1068–1073. doi: 10.6052/0459-1879-2010-6-lxxb2009-351BAI J S, LUO G Q, WANG X, et al. Calculation and analysis of the Mg-W GDI complex loading experiment [J]. Chinese Journal of Theoretical and Applied Mechanics, 2010, 42(6): 1068–1073. doi: 10.6052/0459-1879-2010-6-lxxb2009-351 [6] HERRMANN W. Constitutive equation for the dynamic compaction of ductile porous materials [J]. Journal of Applied Physics, 1969, 40: 2490–2499. doi: 10.1063/1.1658021 [7] WUENNEMANN K, COLLINS G S, MELOSH H J. A strain-based porosity model for use in hydrocode simulations of impacts and implications for transient crater growth in porous targets [J]. Icarus, 2006, 180(2): 514–527. doi: 10.1016/j.icarus.2005.10.013 -

 下载:
下载:


计量
- 文章访问数: 364
- HTML全文浏览量: 326
- PDF下载量: 17
